Rising urban connectivity: London
by Sara Veale
2024
This article is part of FSF10, our series revisiting previous projects and campaigns in honour of the FSF’s tenth anniversary.
In 2016, as part of our Vital Cities, Vital Connections campaign, the FSF worked with researchers on the ground in Asia, the Middle East, Europe and the Americas to assess the efficiency and sustainability of transport systems in 12 cities around the world. We used this data to produce an interactive scorecard highlighting how each city responds to a series of transport-related performance indicators, from safety and accessibility to the application of data and apps.
Eight years on, new conversations around sustainability, wellbeing and economic opportunity have spurred many cities to improve their transport infrastructure as part of their wider development.
This article is the first in a three-part series that takes a look at London, Sydney and Hong Kong – all home to Make studios – and considers how each city’s approach to connectivity has changed since we published our scorecard. As part of our analysis, Maker Jake Alsop, an architect who’s worked in all three locations, offers some personal insight into each city’s cycling and pedestrian infrastructure, public transport network, and breathability.
Global goals
London was one of the global cities we examined in the scorecard – a significant financial and service sector centre, home to major international airports and a large mass transit network. The city received an overall connectivity score of B, putting it in the top three in our study, alongside New York (also B) and Copenhagen (B+).
In 2018, the Mayor of London launched a new transport strategy with an ambitious overarching goal: for 80% of Londoners’ journeys to be made by walking, cycling and public transport by 2041.
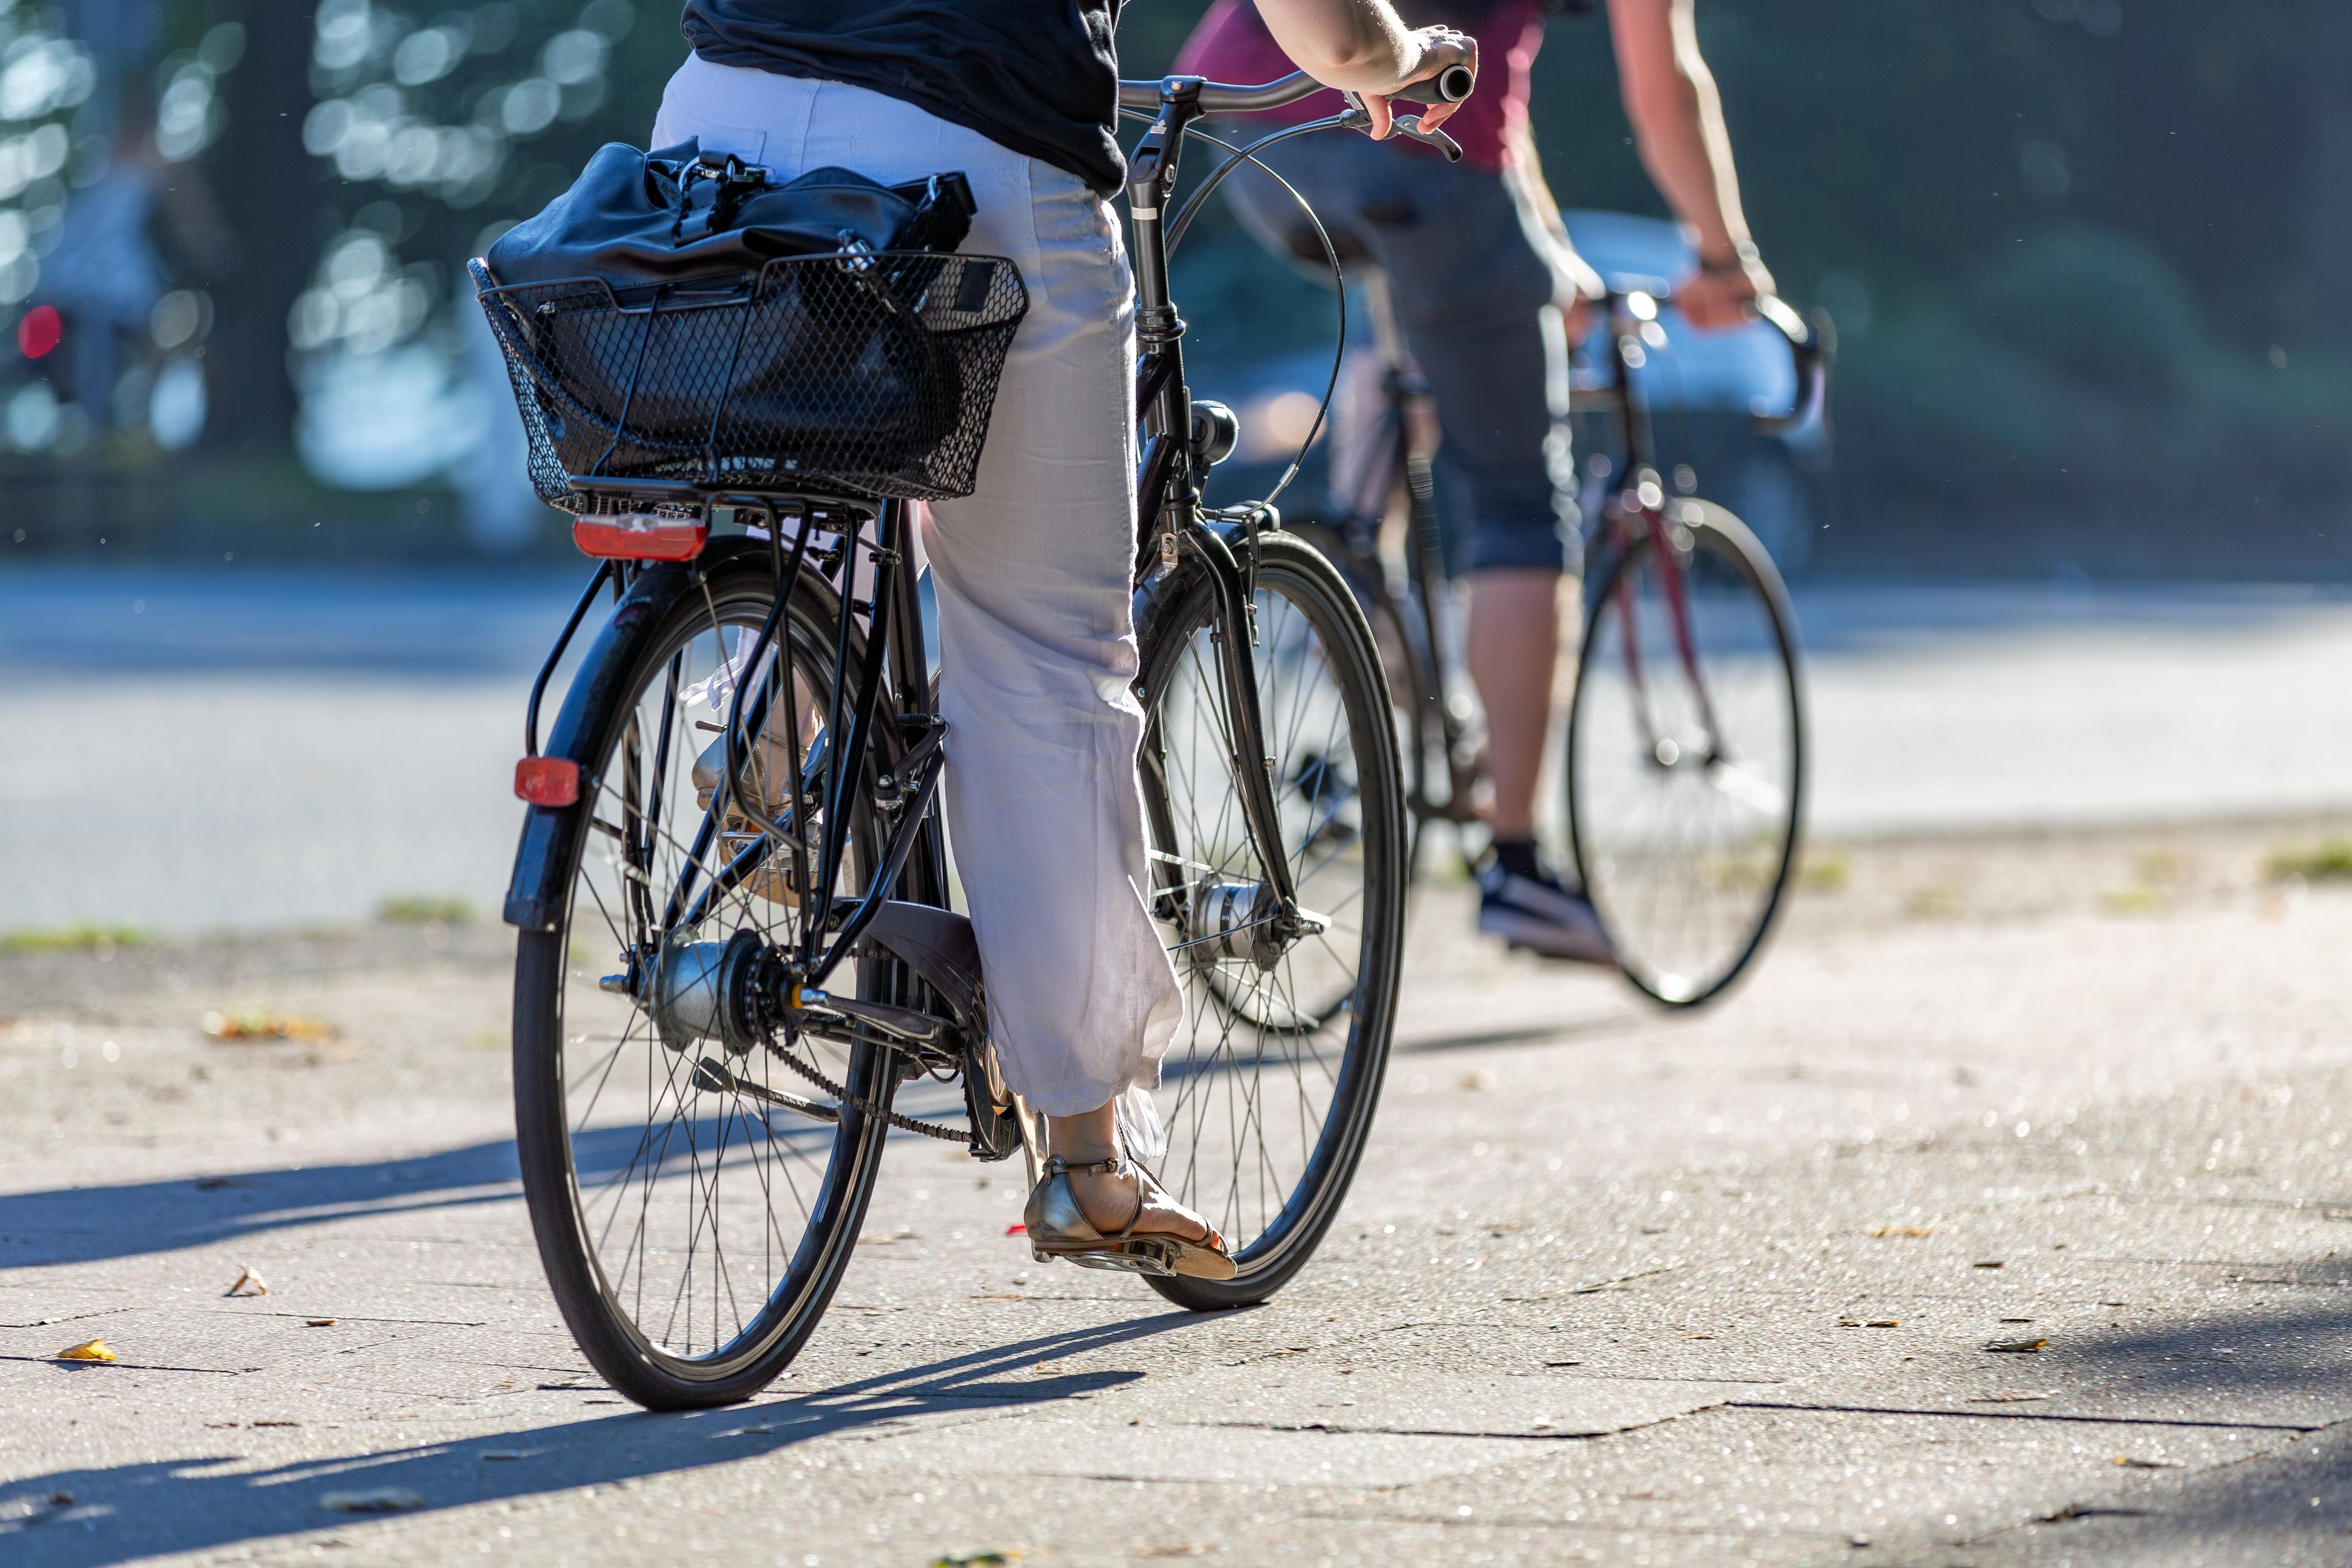
Cycling/pedestrian infrastructure
London received a high score for walkability on our scorecard, but fell somewhat short in the length and quality of its cycle network. The city’s bike infrastructure, along with its pedestrian network, is currently undergoing significant development as part of the Mayor’s transport strategy, which includes the introduction of more than 450km of new cycleway routes by 2024, as well as a walking action plan to make the city more pedestrian-friendly.
In 2021, ‘mini-Hollands’ were delivered in three outer boroughs, each with high-spec Dutch-style infrastructure, and nearly 30 of the city’s key junctions have been redeveloped since 2016 to reduce collisions. The Mayor’s aim is for 70% of Londoners to live within 400m of a safe cycle route by 2041.
Plans are ongoing to build and manage more walkable streets and to integrate these with London’s wider public transport network, with hundreds of improved pedestrian crossings installed in recent years. Transport for London (TfL) is currently trialling new technology to support walking and cycling, including tech that enables traffic signals to adjust in real time in response to bike and foot traffic.
Jake’s view: “I’ve been cycling in London on and off for 15 years. The infrastructure seemed pretty good before I left for Sydney, where I lived between 2017 and 2023 – there were already lots of networks, and there are even more now. Now it really feels like you’re cycling within the traffic in London – like you’re at one with the cars, often going the same speed or quicker and having fairer share of the road. It’s definitely a few years ahead of Sydney and Hong Kong in that respect.
“I’ve noticed since moving back to London that Bromptons and other foldable bikes seem much more common now, maybe because more people have moved out of the city and are now getting the train in and cycling as the second part of commute. I’m also seeing more scooters, e-bikes and hire bikes on the road. It’s quite a chaotic mix but seems to work. As long as there are fewer cars, there seems to be more space for everything else.”
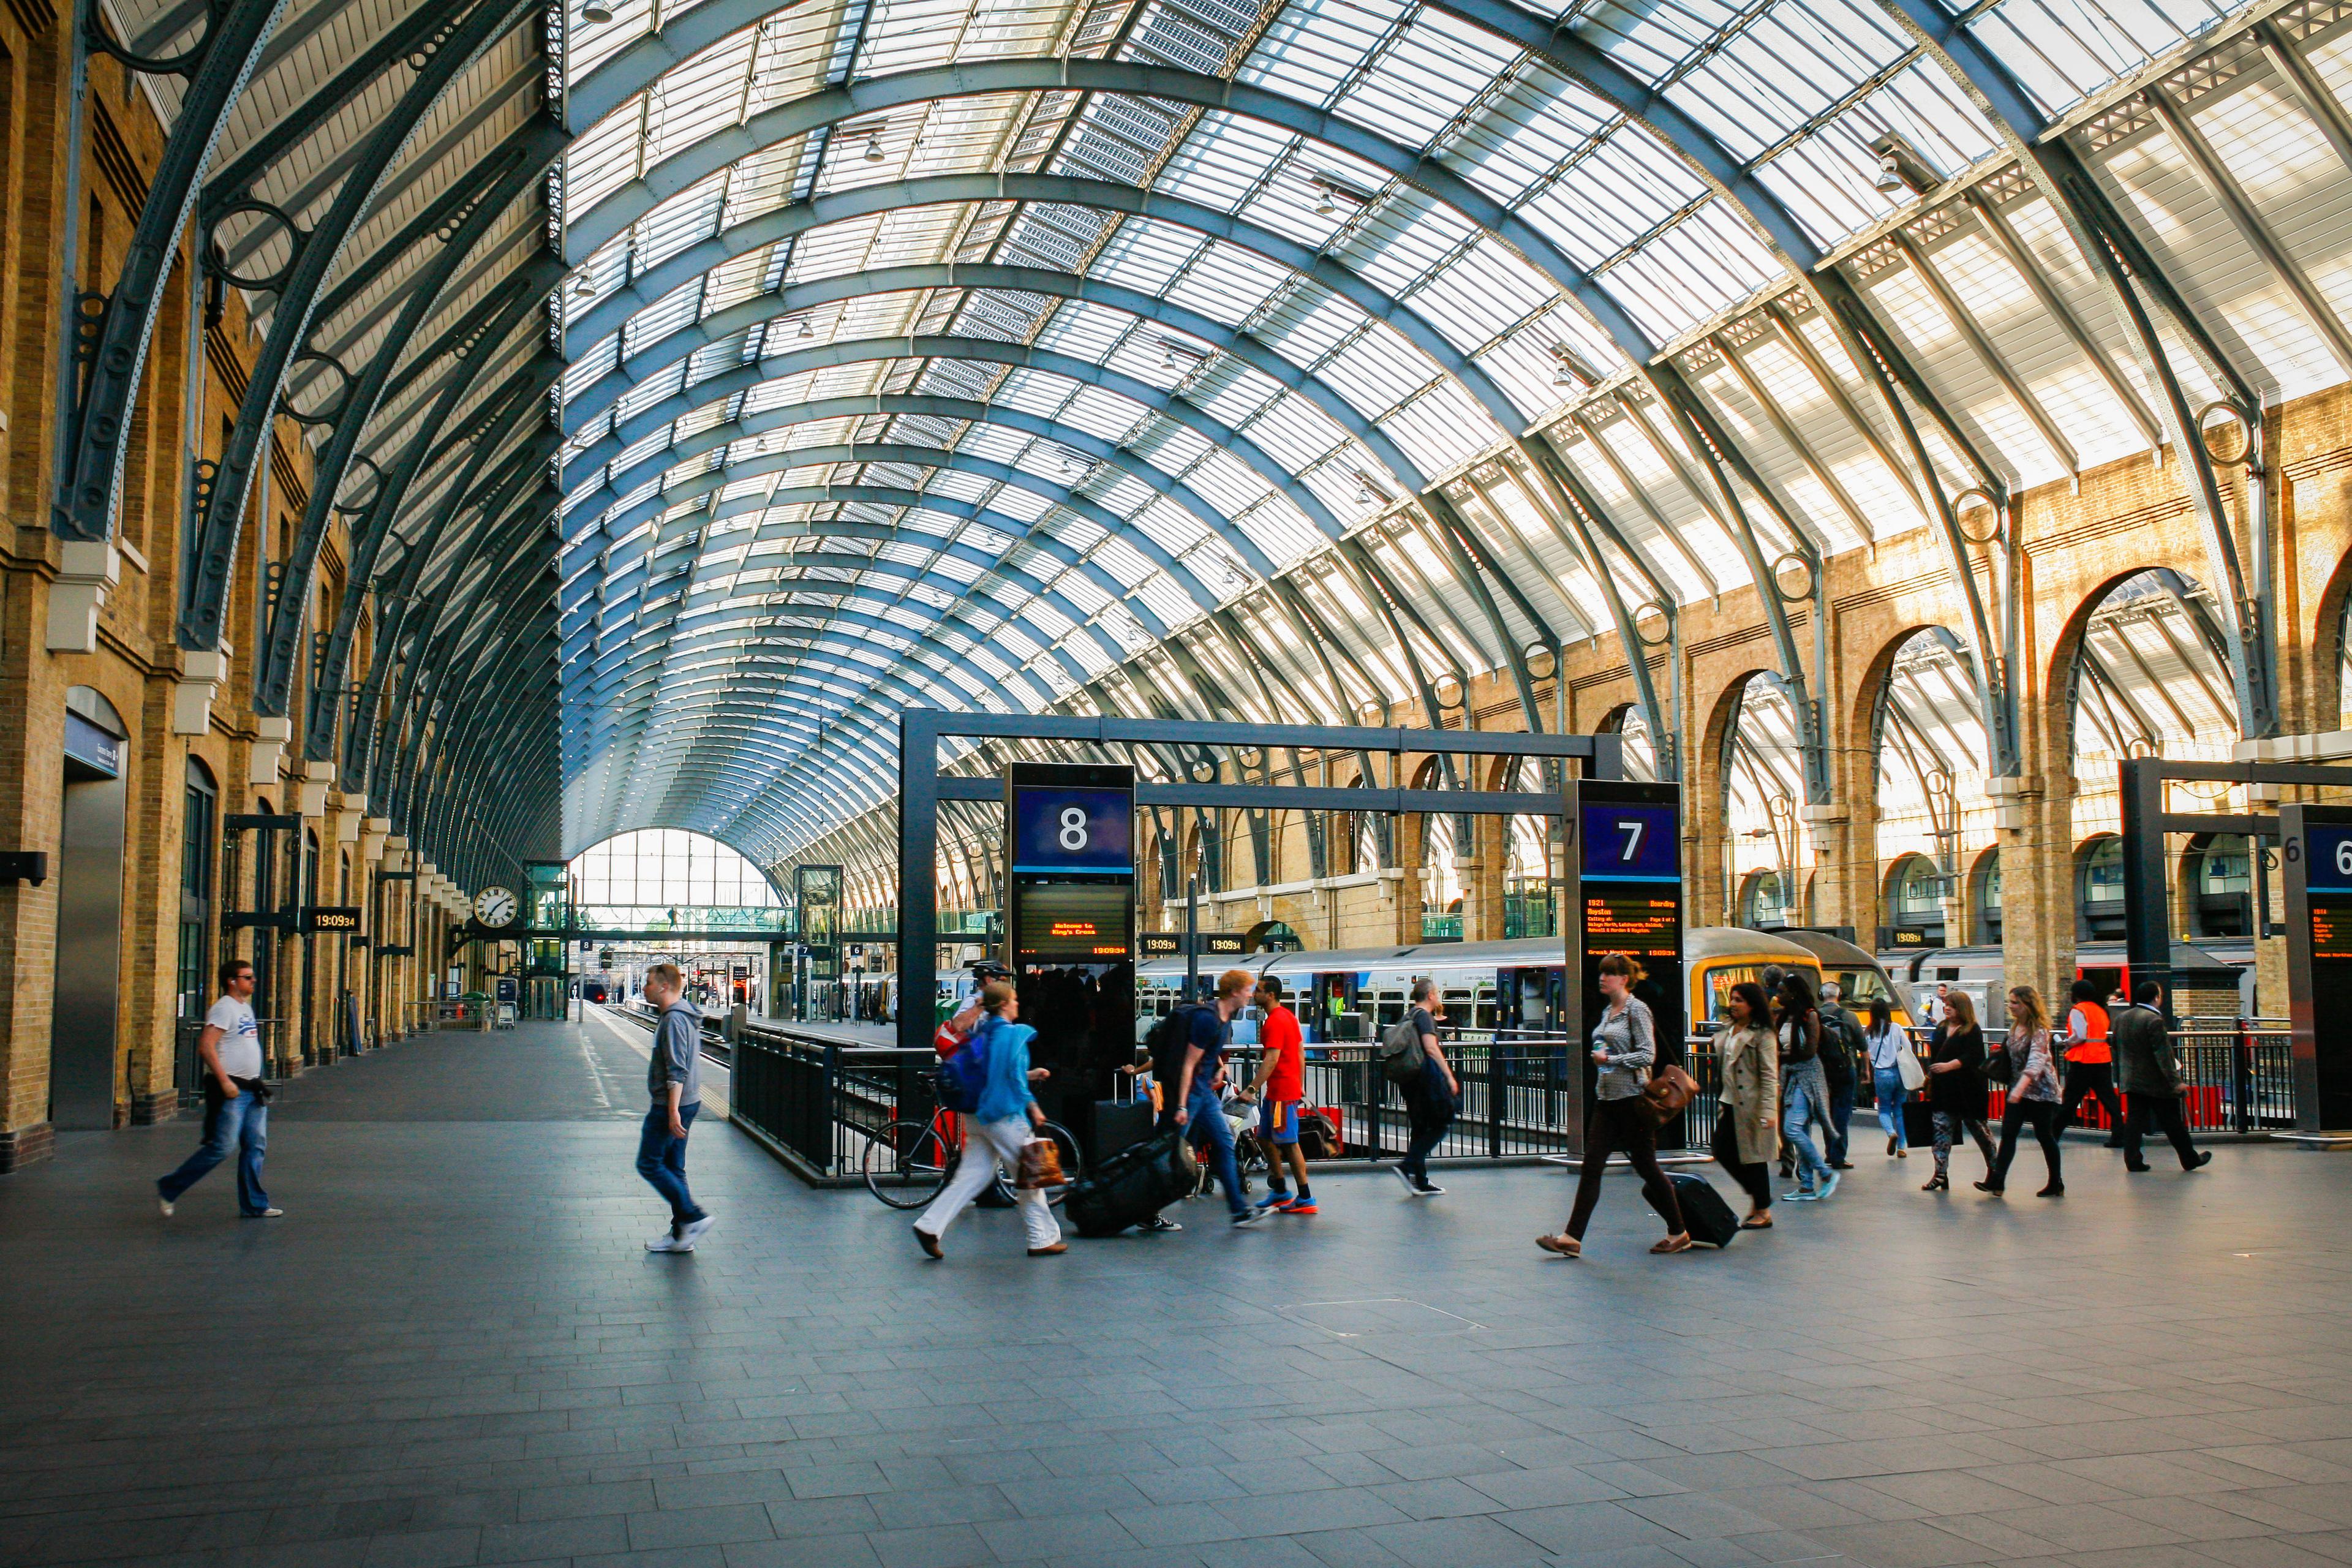
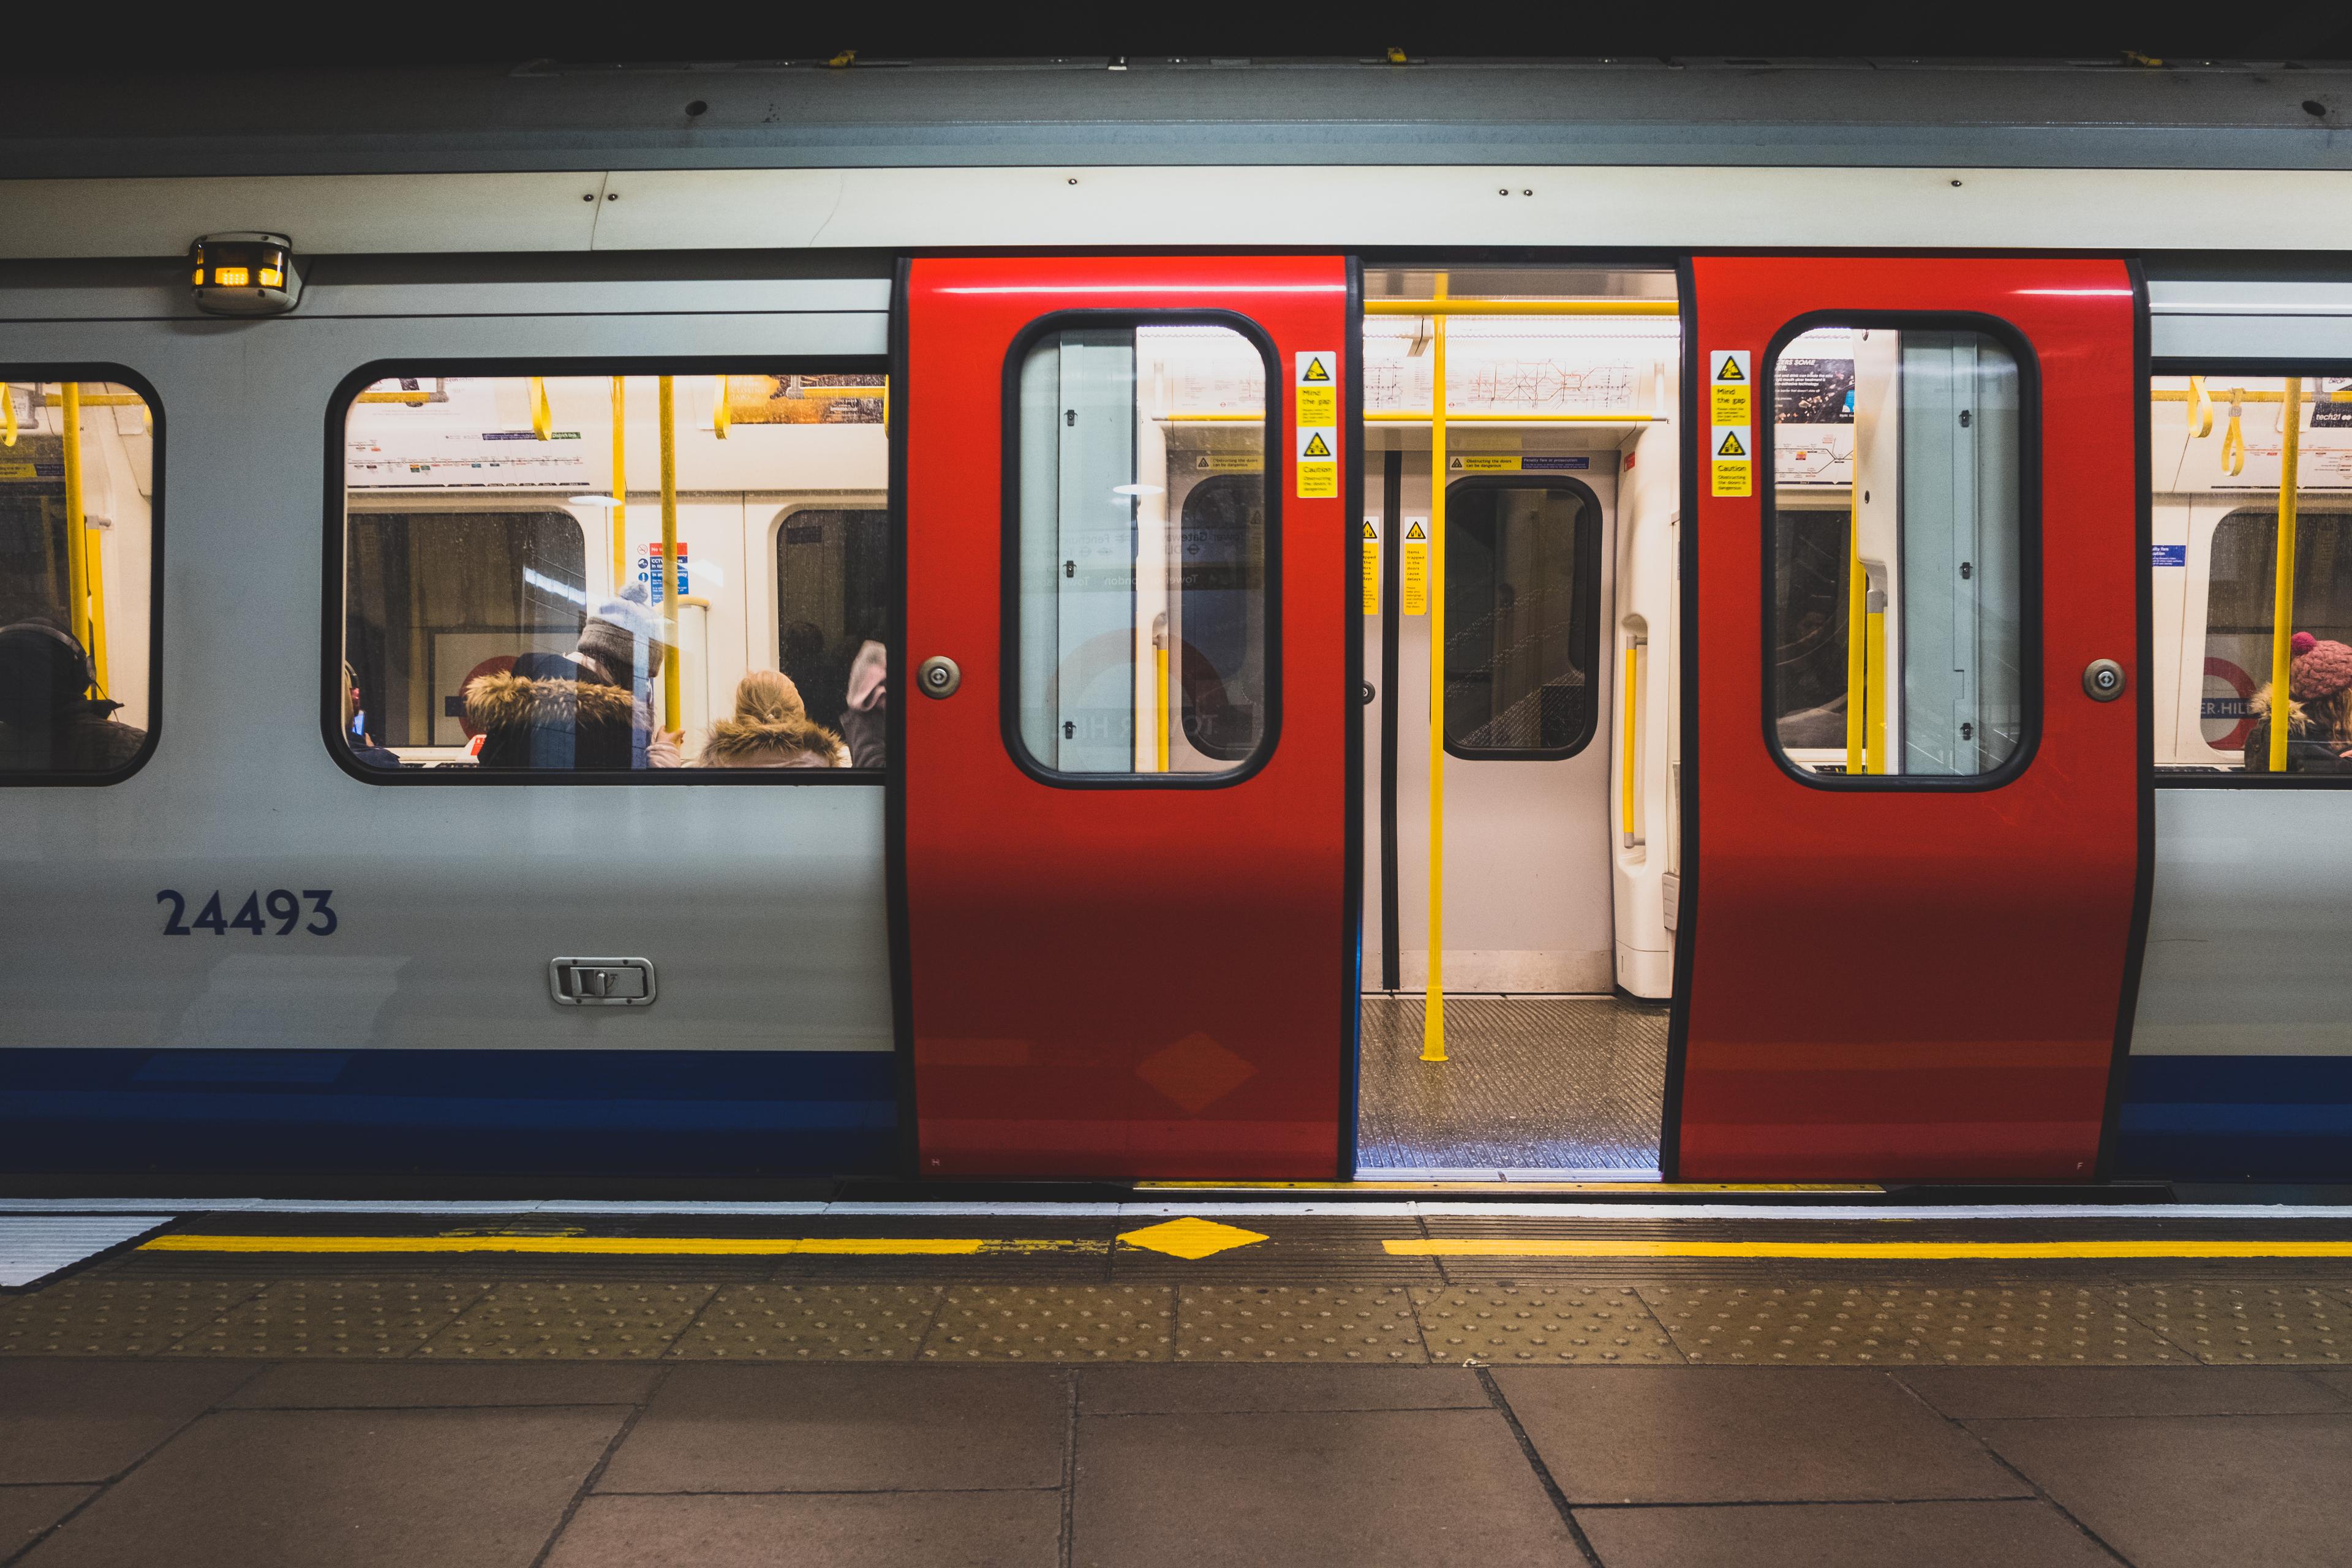
Public transport network
London’s public transport network is one of the world’s largest, and includes underground, bus, train, light rail and river services. The network scored an A on our scorecard, with especially high ratings for its capacity, maintenance and development.
The network received a major upgrade in 2022 with the introduction of the Elizabeth line, an east–west rail service that has created new connections between previously far-flung neighbourhoods, including streamlined journeys to Heathrow Airport. Spanning more than 100km, it supports around 3,500,000 journeys a week and is expected to serve up to 200,000,000 people a year. London has also launched a bus action plan in recent years to make bus travel a zero-carbon option, and expanded its cycle hire scheme – which offers bikes at nearly 800 docking stations around the city – to new areas, including the Queen Elizabeth Olympic Park.
That said, affordability across the city’s public transport network is an issue, particularly for rail services, with prices continuing to rise. A 2023 analysis by Picodi ranks London as the most expensive city in the world for public transport.
Jake’s view: “The Tube doesn’t seem as quite as crammed as I remember, possibly due to increased remote working. Still, it’s still consistently busy, and the frequency of the service does well to keep up with that at all hours – it’s amazing that you rarely wait more than a few minutes for an Underground train, though reliability can sometimes be an issue. In Sydney, the metro doesn’t operate that frequently outside of commuter times, and you’re often waiting 15 minutes or more between trains, even at peak times.
“In terms of new infrastructure, I’ve found the Elizabeth line quite a pleasant experience, with excellent wayfinding at the stations and big airy trains that feel friendly. When it comes to commuting in by train, however, it is super expensive compared to Sydney.”
Breathability
Air pollution is a significant issue in London, contributing to thousands of premature deaths each year. Road vehicles are the single biggest pollutant, releasing gases and particles that are harmful to humans and biodiversity. The city received a D – its lowest scorecard rating – for breathability.
The Mayor’s strategy aims to make London’s transport system zero emission by 2050. The 2019 introduction of the Ultra-Low-Emission Zone (ULEZ) has reduced harmful emissions by 26% as of 2023, and TfL has funded car restrictions at more than several hundred London schools in recent years, leading to improvements in local air quality. Overall, the city has seen a 94% reduction in the number of people living in areas with illegal levels of nitrogen dioxide since 2016.
Jake’s view: “I personally haven’t noticed the air quality in London being particularly bad, but the numbers aren’t great, and it’s a significant step that pollution and emissions are being addressed.”